
geocat.viz.util.plot_extrema_labels#
- geocat.viz.util.plot_extrema_labels(da, transform, proj, label_locations=[], label='L', fontsize=22, whitebbox=False, horizontal=True, show_warnings=True)#
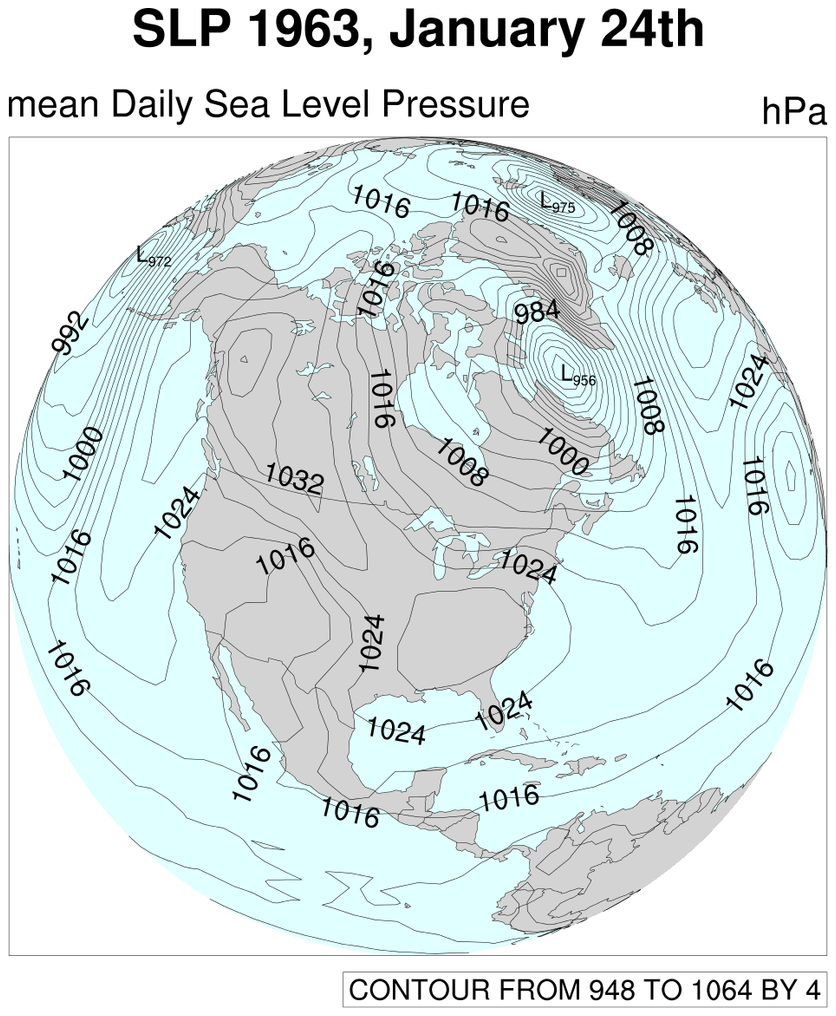
Utility function to plot contour labels.
High/Low contour labels will be plotted using text boxes for more accurate label values and placement. This function is exemplified in the python version of https://www.ncl.ucar.edu/Applications/Images/sat_1_lg.png
- Parameters:
da (
xarray.DataArray) – Xarray data array containing the lat, lon, and field variable data values.transform (
cartopy.crs.CRS) – Instance of CRS that represents the source coordinate system of coordinates. (ex. ccrs.Geodetic()).proj (
cartopy.crs.CRS) – Projection ‘ax’ is defined by. This is the instance of CRS that the coordinates will be transformed to.label_locations (
list) – List of coordinate tuples in GPS form (lon in degrees, lat in degrees) that specify where the contour labels should be plotted. Locations that cannot be translated into the provided projection will be dropped.label (
str) – ex. ‘L’ or ‘H’ The data value will be plotted as a subscript of this label.fontsize (
int) – Font size of regular contour labels.horizontal (
bool) – Setting this to “True” will cause the contour labels to be horizontal.whitebbox (
bool) – Setting this to “True” will cause all labels to be plotted with white backgrounds
- Returns:
extremaLabels (
list) – List of text instances of all contour labels
Examples
See this example notebook: plot_extrema_labels.
More in-depth plotting examples that utilize this function are in the GeoCAT-Examples Gallery. To see more usage cases, search the function on the website.