add_major_minor_ticks#
This notebook is a simple example of the GeoCAT-viz function add_major_minor_ticks.
# Import packages:

import numpy as np
from matplotlib import pyplot as plt
from matplotlib import colors

import geocat.viz as gv
# Create data:

# Make array of x-values, 64 evenly spaced values between 0 and 1
f = np.linspace(0., 1., 64)

twopi = 2 * np.pi

# Create three arrays of y-values to be plotted
x = np.cos(f * 2 * twopi)
y = np.cos(f * 3 * twopi)
z = x * y
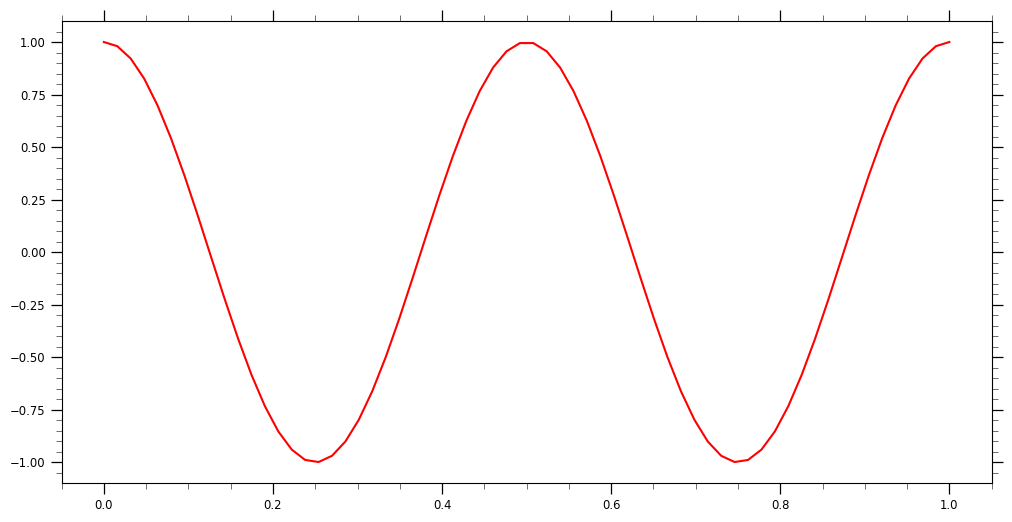
# Plot:

plt.figure(figsize=(12, 6))
ax = plt.axes()

plt.plot(f, x, color='red')

gv.add_major_minor_ticks(ax,
                        x_minor_per_major=4,
                        y_minor_per_major=5,
                        labelsize="small")

plt.show();