

geocat.viz.util.plotELabels#
- geocat.viz.util.plotELabels(da, transform, proj, clabel_locations=[], label='L', fontsize=22, whitebbox=False, horizontal=True)#
Deprecated since version 2023.02.0: The
plotELabelsfunction is deprecated due to naming conventions. Useplot_extrema_labels()instead.Utility function to plot high/low contour labels.
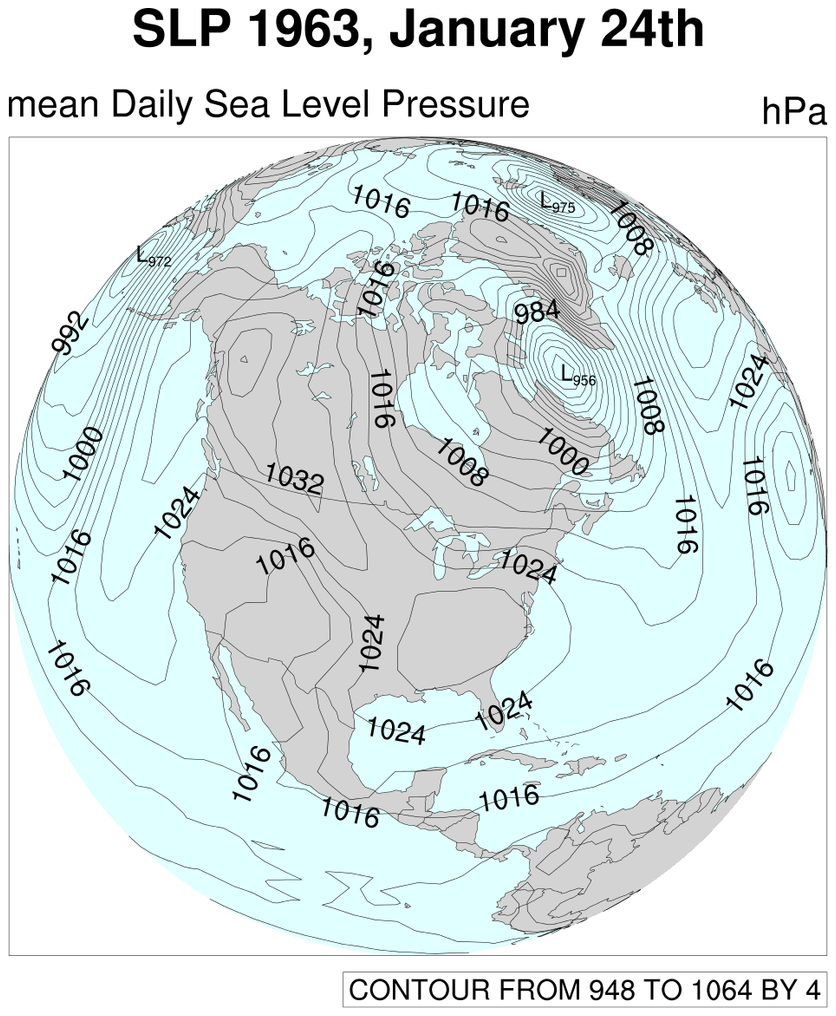
High/Low contour labels will be plotted using text boxes for more accurate label values and placement. This function is exemplified in the python version of sat_1_lg
- Parameters:
da (
xarray.DataArray) – Xarray data array containing the lat, lon, and field variable data values.transform (
cartopy.crs.CRS) – Instance of CRS that represents the source coordinate system of coordinates. (ex. ccrs.Geodetic()).proj (
cartopy.crs.CRS) – Projection ‘ax’ is defined by. This is the instance of CRS that the coordinates will be transformed to.clabel_locations (
list) – List of coordinate tuples in GPS form (lon in degrees, lat in degrees) that specify where the contour labels should be plotted.label (
str) – ex. ‘L’ or ‘H’ The data value will be plotted as a subscript of this label.fontsize (
int) – Font size of regular contour labels.horizontal (
bool) – Setting this to “True” will cause the contour labels to be horizontal.whitebbox (
bool) – Setting this to “True” will cause all labels to be plotted with white backgrounds
- Returns:
extremaLabels (
list) – List of text instances of all contour labels
Examples
All usage examples are within the GeoCAT-Examples Gallery. To see more usage cases, search the function on the website.