
set_titles_and_labels#
This notebook is a simple example of the GeoCAT-viz function set_titles_and_labels.
# Import packages:

import numpy as np
import matplotlib.pyplot as plt

import geocat.viz as gv
# Generate example data:

npts = 500

x = 500 + 0.9 * np.arange(0, npts) * np.cos(np.pi / 100 * np.arange(0, npts))
y = 500 + 0.9 * np.arange(0, npts) * np.sin(np.pi / 100 * np.arange(0, npts))
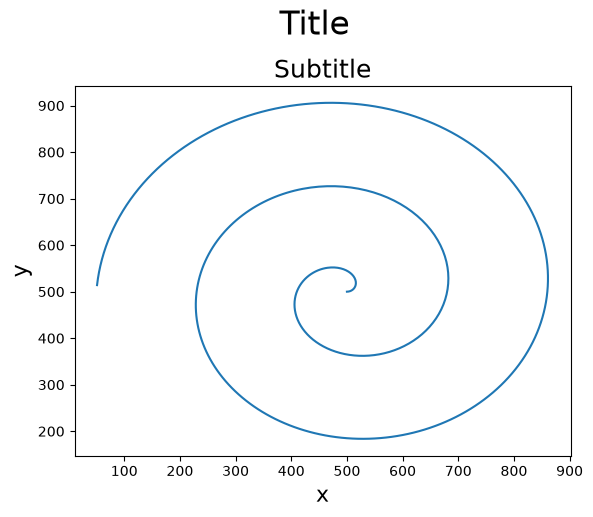
# Create plot with a subtitle

# Create a figure
fig, ax = plt.subplots()

# Plot the example data
ax.plot(x, y)

# Use geocat.viz.util convenience function to set titles and labels
gv.set_titles_and_labels(ax,
                         maintitle="Title",
                         maintitlefontsize=24,
                         subtitle="Subtitle",
                         xlabel="x",
                         ylabel="y",
                         labelfontsize=16)

# Show the plot
plt.show();
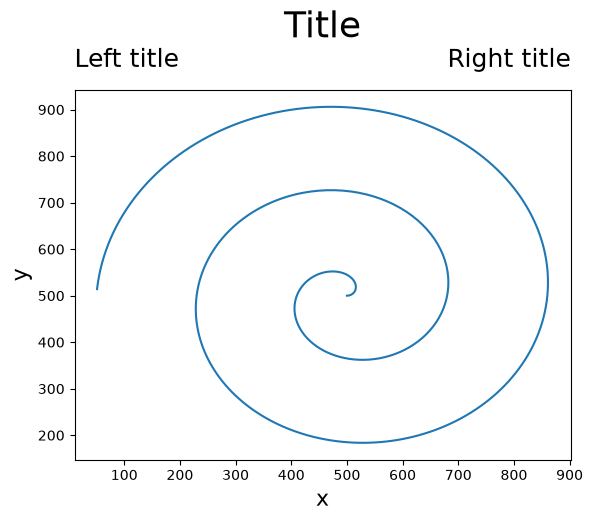
# Create plot with left and right subtitles

# Create a figure
fig, ax = plt.subplots()

# Plot the example data
ax.plot(x, y)

# Use geocat.viz.util convenience function to set titles and labels
gv.set_titles_and_labels(ax,
                         maintitle="Title",
                         maintitlefontsize=24,
                         lefttitle="Left title",
                         righttitle='Right title',
                         xlabel="x",
                         ylabel="y",
                         labelfontsize=16)

# Show the plot
plt.show();