
set_axes_limits_and_ticks#
This notebook is a simple example of the GeoCAT-viz function set_axes_limits_and_ticks.
# Import packages:

import numpy as np
import matplotlib.pyplot as plt

import geocat.viz as gv
# Generate example data:
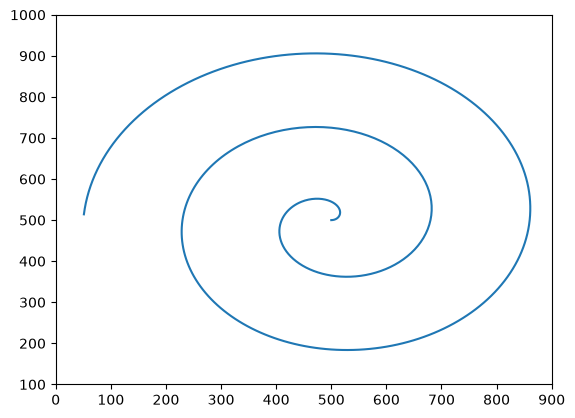
npts = 500
x = 500 + 0.9 * np.arange(0, npts) * np.cos(np.pi / 100 * np.arange(0, npts))
y = 500 + 0.9 * np.arange(0, npts) * np.sin(np.pi / 100 * np.arange(0, npts))
# Create plot

# Create a figure
fig, ax = plt.subplots()

# Plot the example data
ax.plot(x, y)

# Use geocat.viz.util convenience function to set axes limits and tick labels
gv.set_axes_limits_and_ticks(ax,
                             xlim=(0, 900),
                             ylim=(100, 1000),
                             xticks=range(0, 901, 100),
                             yticks=range(100, 1001, 100))

# Show the plot
plt.show();