
find_local_extrema#
This notebook is a simple example of the GeoCAT-viz function find_local_extrema.
import numpy as np
import xarray as xr
import matplotlib.pyplot as plt

import geocat.viz as gv
# Generate dummy data
data = [[1, 4, 5, 6, 8.2],
        [9, 8.4, 10, 10.6, 9.7],
        [4.4, 5, 0, 6.6, 1.4],
        [4.6, 5.2, 1.5, 7.6, 2.4]]

# Convert data into type xarray.DataArray
data = xr.DataArray(data,
                    dims=["lat", "lon"],
                    coords=dict(lat=np.arange(4), lon=np.arange(5)))
# Plot:
# Generate figure (set its size (width, height) in inches)
plt.figure(figsize=(9.5, 8))
# Generate axes
ax = plt.axes()
# Plot filled contour and contour lines
contours = ax.contourf(data)
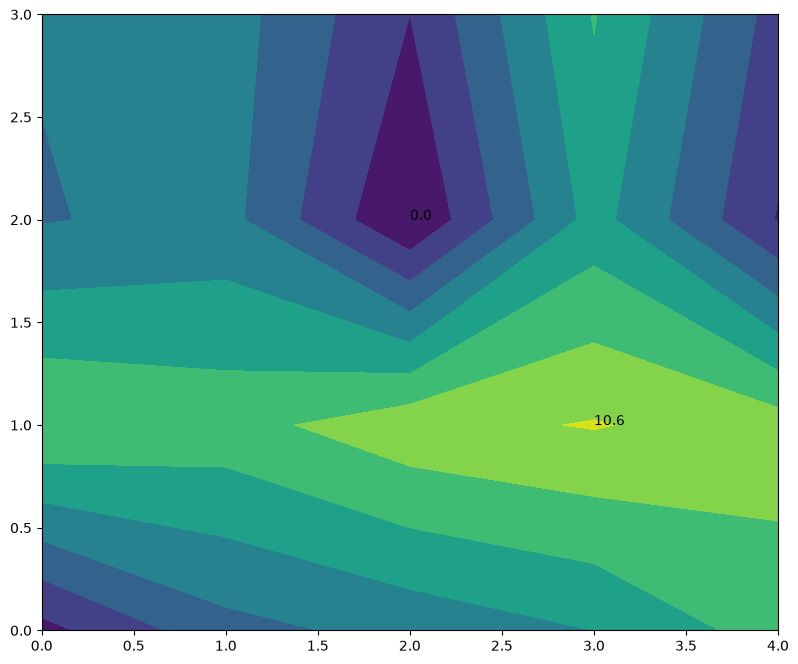
# Find local min/max extrema with GeoCAT-Viz find_local_extrema
lmin = gv.find_local_extrema(data, eType='Low')[0]
lmax = gv.find_local_extrema(data, eType='High')[0]
# Plot labels for local extrema
min_value = data.data[lmin[1]][lmin[0]]
ax.text(lmin[0], lmin[1], str(min_value))
max_value = data.data[lmax[1]][lmax[0]]
ax.text(lmax[0], lmax[1], str(max_value))
# Show plot
plt.show();