
add_right_hand_axis#
This notebook is a simple example of the GeoCAT-viz function add_right_hand_axis.
import numpy as np
import xarray as xr
import matplotlib as mpl
import matplotlib.pyplot as plt
from cartopy.mpl.ticker import LatitudeFormatter

import geocat.datafiles as gdf
import geocat.viz as gv
# Read in Data

# Open a netCDF data file using xarray default engine and load the data into an xarray
ds = xr.open_dataset(gdf.get('netcdf_files/atmos.nc'), decode_times=False)

# Select zonal wind
u = ds.U.isel(time=0)

# Get zonal mean
u_av = u.mean(dim='lon')
Downloading file 'netcdf_files/atmos.nc' from 'https://github.com/NCAR/geocat-datafiles/raw/main/netcdf_files/atmos.nc' to '/home/docs/.cache/geocat'.
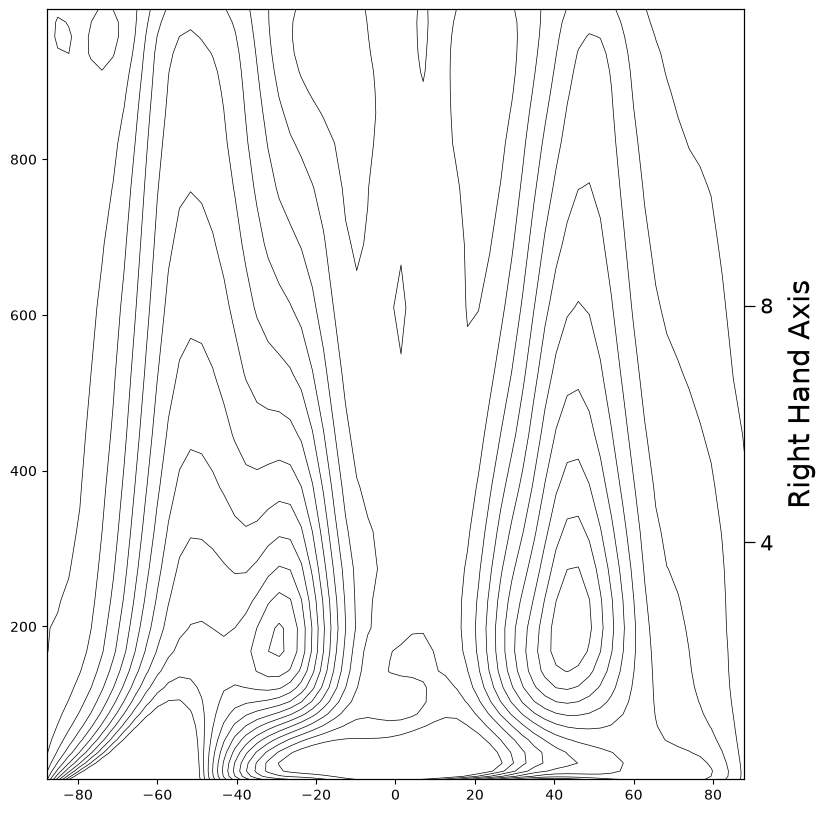
# Plot:

# Generate figure (set its size (width, height) in inches)
plt.figure(figsize=(9, 10))
ax1 = plt.gca()

# Plot contour lines
contours = u_av.plot.contour(ax=ax1,
                             levels=13,
                             vmin=-8,
                             vmax=40,
                             colors='black',
                             linewidths=0.5,
                             linestyles='solid',
                             add_labels=False)

# Add second axis to plot heights (heights chosen arbitrarily)
gv.add_right_hand_axis(ax1,
                       label="Right Hand Axis",
                       ylim=(0, 13),
                       yticks=np.array([4, 8]),
                       ticklabelsize=15,
                       axislabelsize=21)

plt.show();